SBR — Sector Balance Ratio, the sector balance coefficient in the SEII model. It shows how evenly the neighboring sectors are connected: Behavior, Choice, Demand and Money, and where an imbalance appears between them inside the Protective Shell of Personality.
SBR — Sector Balance Ratio is the sector balance coefficient. It shows how evenly the neighboring sectors of the Protective Shell of Personality are connected with each other. It is not the general SEII calculation, not an indicator of external pressure and not a percentage of a test answer. SBR is needed for a separate analysis of transitions inside the circle:
Behavior → Choice → Demand → Money → Behavior.
SBR appears after the sector values have already been calculated: Behavior, Choice, Demand and Money. In this article, these values are treated as the source data for calculating SBR. SBR itself does not explain where the sector values came from, but shows how evenly they are connected with each other inside the Direct Course of the Fundamental Law of Political Economy.
The main task of SBR is to find not just a weak sector, but a weak transition between neighboring sectors. Sometimes the problem is not in Behavior separately and not in Choice separately, but precisely between them. The same can happen between Choice and Demand, Demand and Money, Money and the next Behavior.
What SBR shows
SBR shows the balance between two neighboring sectors. It answers a simple question: how evenly one sector is connected with the next one. If two neighboring sectors are close to each other, the transition between them is considered stable. If one sector differs sharply from the other, an imbalance appears between them, which may become a source of turbulence.
SBR does not show which sector is “better” or “worse”. It shows the distance between neighboring sectors. Therefore, the main meaning of SBR is not the superiority of one sector over another, but closeness to equilibrium. The closer the SBR value is to one, the smoother the transition inside the circle.
If we look only at separate sectors, we can see four values. But this is not enough. Sectors do not work separately, but in a chain. Behavior must pass into Choice, Choice into Demand, Demand into Money, Money into the next Behavior. SBR shows the quality of these transitions.
Source data for SBR
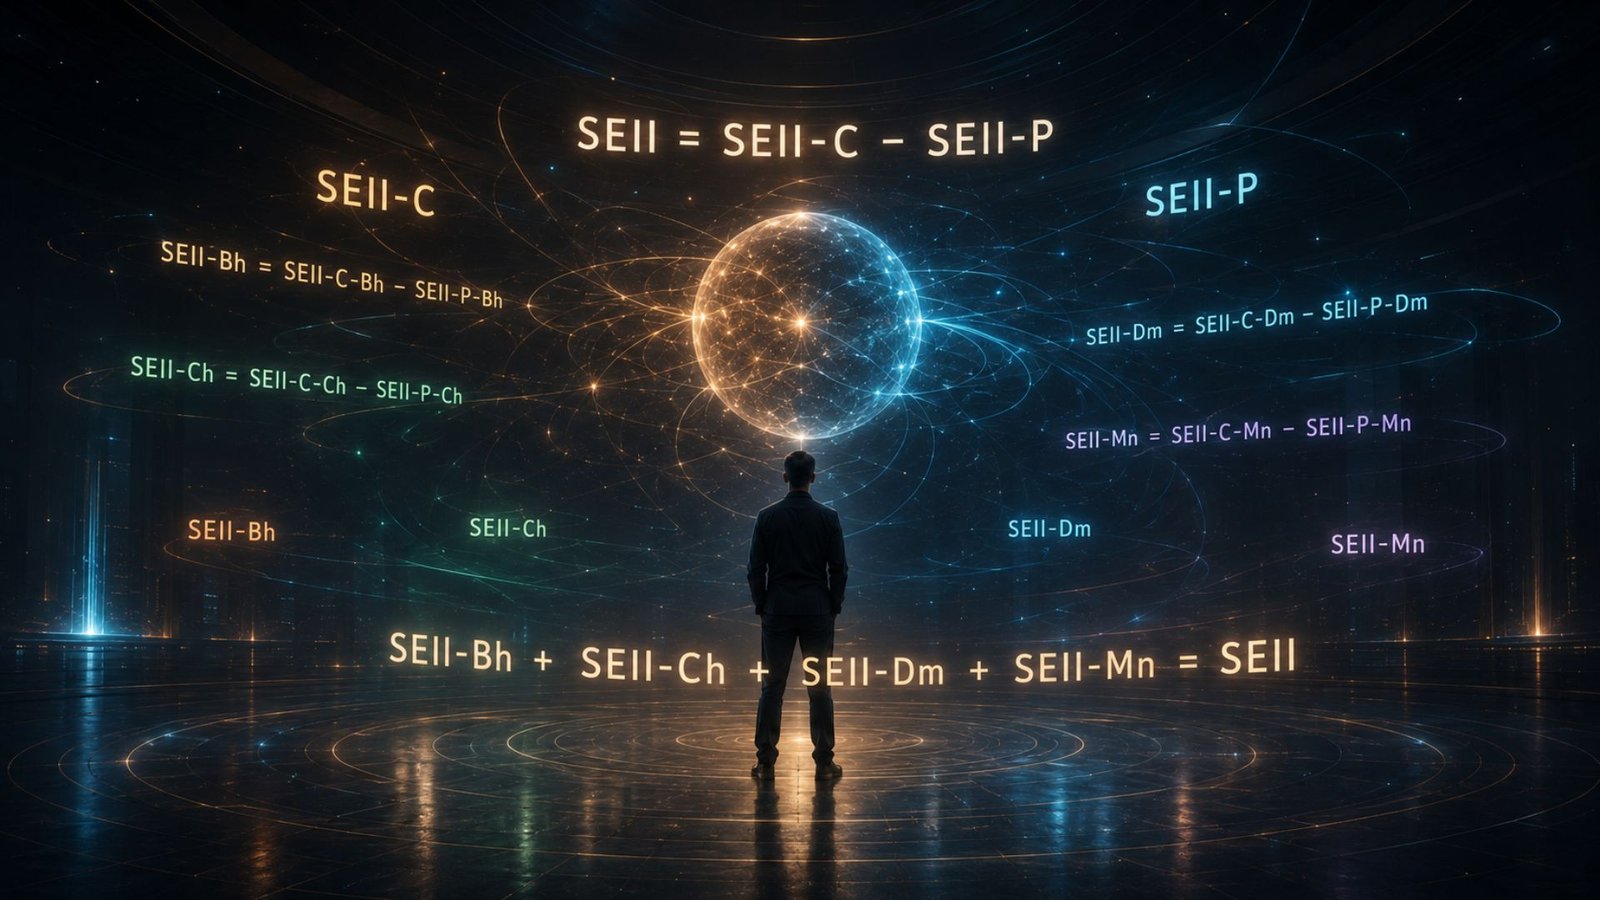
To calculate SBR, already prepared sector values are needed. These are the values SEII(Bh), SEII(Ch), SEII(Dm) and SEII(Mn). They show the state of the four sectors: Behavior, Choice, Demand and Money. SBR does not replace the calculation of these values, but works after them.
- SEII(Bh) — the Behavior sector.
- SEII(Ch) — the Choice sector.
- SEII(Dm) — the Demand sector.
- SEII(Mn) — the Money sector.
If these four sector values do not exist, SBR cannot be calculated. The sector balance coefficient is not taken out of nowhere and does not create sector values by itself. It only compares already calculated neighboring sectors and shows how evenly they stand in relation to each other.
The detailed origin of the sector values is explained in a separate article on the practical calculation of SEII. In the article about SBR, something else is important: how, after receiving sector values, to determine where there is an even connection between them and where a rupture appears between neighboring parts of the circle.
Direction of SBR calculation
SBR is not calculated in an arbitrary direction. The direction is already set by the Direct Course of the Fundamental Law of Political Economy. The movement goes in a circle: Behavior → Choice → Demand → Money → Behavior. Therefore, SBR is always read inside this direction, not between randomly selected sectors.
Behavior → Choice → Demand → Money → Behavior
First, the balance between Behavior and Choice is examined. Then the balance between Choice and Demand is examined. After that, the balance between Demand and Money is examined. The final transition shows how Money returns into the next Behavior. This is how the logic of the Direct Course is preserved.
- SBR(Bh→Ch) — the balance of the transition from Behavior to Choice.
- SBR(Ch→Dm) — the balance of the transition from Choice to Demand.
- SBR(Dm→Mn) — the balance of the transition from Demand to Money.
- SBR(Mn→Bh) — the balance of the transition from Money to the next Behavior.
The direction does not need to be introduced as a separate indicator, because it is already inside the Fundamental Law of Political Economy. SBR does not invent the direction of movement. It only measures how evenly neighboring sectors are connected inside the already defined circle.
SBR formula
SBR is calculated through the closeness of two neighboring sectors to one. For this, the smaller value is divided by the larger value. This method is needed because imbalance can go in either direction. If one sector is twice as large as another, it is still an imbalance, even if the ordinary ratio gives a number greater than one.
SBR(A→B) = smaller value / larger value
In technical notation:
SBR(A→B) = min(SEII(A), SEII(B)) / max(SEII(A), SEII(B))
If two neighboring sectors are equal, the smaller and larger values coincide. Then the result is 1. This is ideal balance. If one sector is noticeably smaller than the other, the result goes down. The closer SBR is to zero, the stronger the rupture between neighboring sectors.
SBR across the four transitions of the circle
- SBR(Bh→Ch) = min(SEII(Bh), SEII(Ch)) / max(SEII(Bh), SEII(Ch))
- SBR(Ch→Dm) = min(SEII(Ch), SEII(Dm)) / max(SEII(Ch), SEII(Dm))
- SBR(Dm→Mn) = min(SEII(Dm), SEII(Mn)) / max(SEII(Dm), SEII(Mn))
- SBR(Mn→Bh) = min(SEII(Mn), SEII(Bh)) / max(SEII(Mn), SEII(Bh))
These four calculations give a map of transitions inside the circle. They do not show the general SEII and do not replace the sector map. Their task is narrower: to show which transition between neighboring sectors is even, and which transition begins to create an internal rupture.
Why one is the ideal value
A value of 1 means that neighboring sectors are equal to each other. In this case, the transition between them does not create imbalance. Behavior calmly passes into Choice, Choice calmly passes into Demand, Demand calmly passes into Money, and Money calmly returns into the next Behavior.
If SBR is close to 1, the contour works evenly. This does not mean that there is no pressure at all. It means that neighboring sectors hold the movement in a coordinated way. Pressure may exist, but it does not break the connection between parts of the circle and does not create sharp turbulence.
The ideal in SBR is not the maximum number. The ideal is closeness to one. Therefore, the value 2 in an ordinary ratio is not a good result. It shows the same imbalance as 0.5, only in the opposite direction. For balance, superiority is not important; the evenness of neighboring sectors is important.
Example of an even transition
Suppose the Behavior sector has a value of 20, and the Choice sector also has a value of 20. In this case, there is no rupture between them. The smaller value is 20, and the larger value is also 20. Division gives 1. This means an even transition between Behavior and Choice.
SBR(Bh→Ch) = 20 / 20 = 1
In human terms, this means that a person’s action normally passes into the choice of direction. The person does not simply act chaotically and does not simply think about options without action. Behavior and Choice are connected evenly. This part of the circle does not create internal turbulence.
Example of imbalance
Now let us imagine that the Behavior sector has a value of 20, while the Choice sector has a value of 40. A strong rupture appears between them. To calculate SBR, the smaller value 20 is taken and divided by the larger value 40. The result is 0.5. This means that the connection between the sectors is disturbed.
SBR(Bh→Ch) = 20 / 40 = 0.5
In human terms, this may mean that Choice is overloaded relative to Behavior. A person may see many options, but their action does not correspond to this level of choice. Unevenness appears inside the circle: one sector pulls more strongly, while the other does not support it at the same level.
Imbalance in the opposite direction
If the values are reversed, the logic does not change. Suppose Behavior equals 40, and Choice equals 20. In an ordinary ratio, one could get 2, but for SBR this is not considered a good result. We again take the smaller value and divide it by the larger value.
SBR(Bh→Ch) = 20 / 40 = 0.5
The strength of the imbalance remains the same. Only the direction differs. In the first case, Choice was higher than Behavior. In the second case, Behavior is higher than Choice. But in both cases the circle is uneven. Therefore, SBR shows not who is stronger, but how far neighboring sectors have moved away from each other.
How to read SBR around the circle
One SBR shows only one transition. To see the state of the whole circle, four transitions must be viewed together. If all of them are close to one, the circle works evenly. If one transition differs sharply from the others, that is where the place of turbulence is located.
- SBR(Bh→Ch) = 0.95
- SBR(Ch→Dm) = 0.92
- SBR(Dm→Mn) = 0.40
- SBR(Mn→Bh) = 0.90
In this example, it is clear that the weakest transition is between Demand and Money. The other transitions are close to one, while one has sharply fallen. This means that the problem is not in the whole circle at once, but precisely in the connection between needs and the resource that must secure these needs.
What low SBR shows
Low SBR shows that two neighboring sectors do not match each other well. This does not necessarily mean that one of them is completely destroyed. It means that there is a rupture between them. The lower the SBR, the stronger the unevenness of the transition and the higher the risk of turbulence in this part of the circle.
If weak SBR is located between Behavior and Choice, a person may act but poorly connect action with direction. If weak SBR is located between Choice and Demand, a person may have options but not turn them into clear needs. If weak SBR is located between Demand and Money, needs are not secured by resource.
If weak SBR is located between Money and Behavior, it means that the result does not return into new action. Money may appear, but it does not strengthen the next circle. In such a case, a person or system does not convert the received resource into stable Behavior, and the circle begins again with a loss of strength.
SBR and turbulence
Turbulence appears where the circle loses evenness. It does not appear simply because one sector has a high value. A high value in itself is not a problem. The problem appears when the neighboring sector sharply does not match it, and the transition between them becomes weak.
If all transitions are close to one, the contour works calmly. Even if the sector values are not ideal, they move in a coordinated way. But if one transition drops strongly, the circle begins to move in jerks. In one place energy passes, in another it gets stuck, in a third it is compensated too late.
Therefore, SBR is needed for the early detection of turbulence. It shows not only the fact of a problem, but also its location. This is important because it is not necessary to correct the whole circle at once, but the specific transition between two sectors where equilibrium is most disturbed.
SBR and the pressure tail
SBR must not be mixed with the pressure tail. The tail shows the unpassed part of the impulse inside a sector. SBR shows the balance between neighboring sectors. These are different levels of analysis. If they are mixed, the coefficient turns into a percentage, and the percentage begins to be mistakenly perceived as a connection between sectors.
The tail may increase the load on the neighboring sector, but SBR still shows something else: how close two neighboring sector values are to each other. Therefore, the tail helps to understand the unpassed part of the impulse, while SBR helps to understand the evenness of the transition between parts of the circle.
For example, a sector may have a tail, but the neighboring sector may still be close enough to it in value. Then the connection may remain relatively even. In another case, the tail may be small, but the values of neighboring sectors may sharply diverge. Then SBR will show imbalance.
Practical meaning of SBR
The practical meaning of SBR is to find not just a weak sector, but a weak transition. This is more important than it may seem. Sometimes the problem is not in Behavior itself and not in Choice itself, but precisely in the fact that Behavior passes poorly into Choice.
The same can happen between Choice and Demand. A person may have options, but these options do not turn into a clear understanding of needs. Then working only with the expansion of choice will not solve the problem. It is necessary to look at the transition from choice to real demand.
Between Demand and Money, the problem appears when needs exist but do not receive resource. Between Money and Behavior, the problem appears when the resource does not return into new action. SBR shows these transitions separately and helps to understand where the circle loses strength.
Conclusion
SBR — Sector Balance Ratio — is the sector balance coefficient. It shows how evenly neighboring sectors of the Protective Shell of Personality are connected. It must not be replaced by the general SEII, the pressure tail or percentages of test answers. It is a separate instrument for analyzing transitions inside the circle.
The main reference point of SBR is closeness to one. If SBR equals 1 or is close to 1, neighboring sectors are connected evenly. If SBR goes down, a rupture appears. The lower the value, the stronger the imbalance between neighboring sectors and the higher the risk of turbulence.
The main result of the SBR calculation is the map of transitions. It shows exactly where the circle loses balance: between Behavior and Choice, between Choice and Demand, between Demand and Money or between Money and Behavior. Therefore, SBR is needed not for a general assessment, but for the precise search for the place of imbalance.
Iv.Spolan
Author of the model “The Fundamental Law of Political Economy”